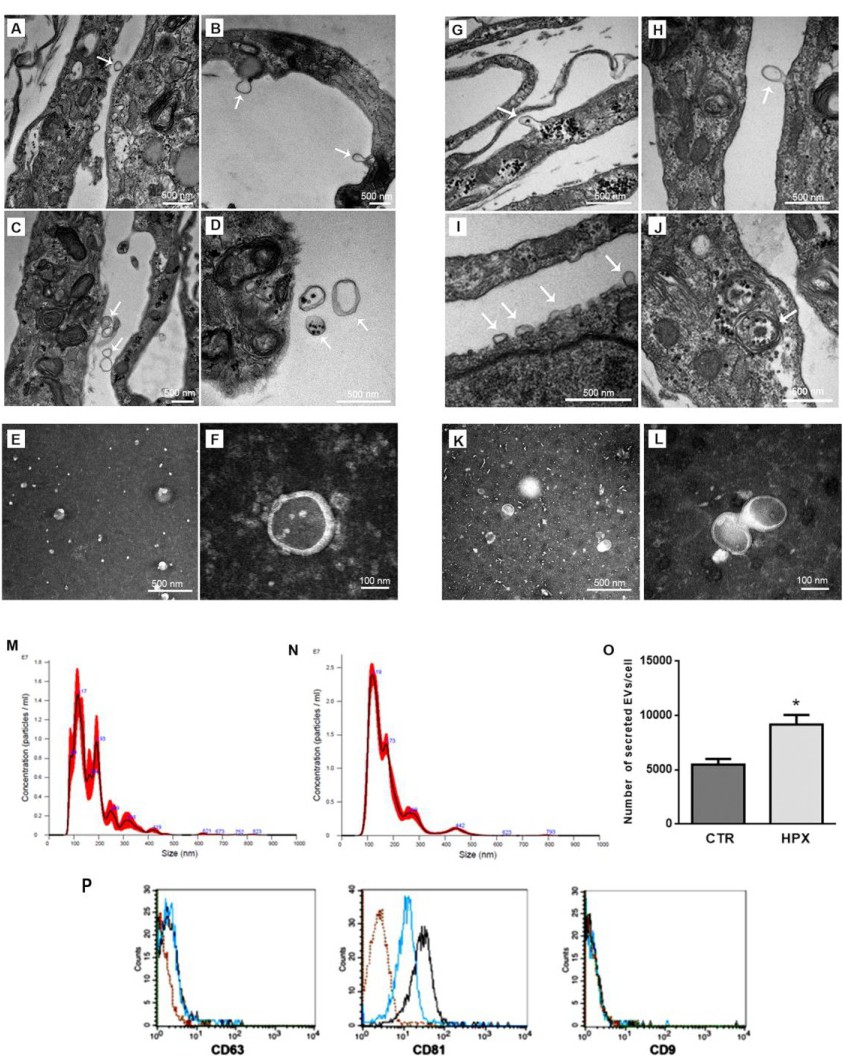
Fig. 1. Modulation of ADMSC-EVs secretion by hypoxia. Electron microscopy images of ADMSCs cultured for 72 h in normoxia and the presence of vesicular structures indicated by white arrows, scale bars = 500 nm (A-D). Images of EVs isolated from ADMSCs cultured in normoxia, scale bar in E = 500 nm, scale bar in F = 100 nm (E, F). Images of ADMSCs cultured for 72 h in hypoxia and the presence of vesicular structures indicated by white arrows, scale bars = 500 nm (G-J). Images of EVs isolated from ADMSCs cultured in hypoxia, scale bar in K = 500 nm, scale bar in L = 100 nm (K, L). Representative Nanosight analysis of size distribution of EV CTR (M) and EV HPX (N) isolated from ADMSCs supernatant. Relation between the number of EVs isolated from supernatant and the number of ADMSCs in culture. Data represent mean ± SEM (n = 8). (*, P<0.05, assessed by the t-test) (O). Representative micrograph of EVs characterization by flow cytometry showing positivity for exosome markers CD63 and CD81, but not CD9.The lines indicate the fluorescent intensity for each marker: black line indicates EV CTR, blue line indicates EV HPX and red line indicates EVs incubated with secondary IgG, as negative control (P). Abbreviations: EV, extracellular vesicles; CTR, control; HPX, hypoxia.